
App template
Gauge: a saas metrics dashboard app template.
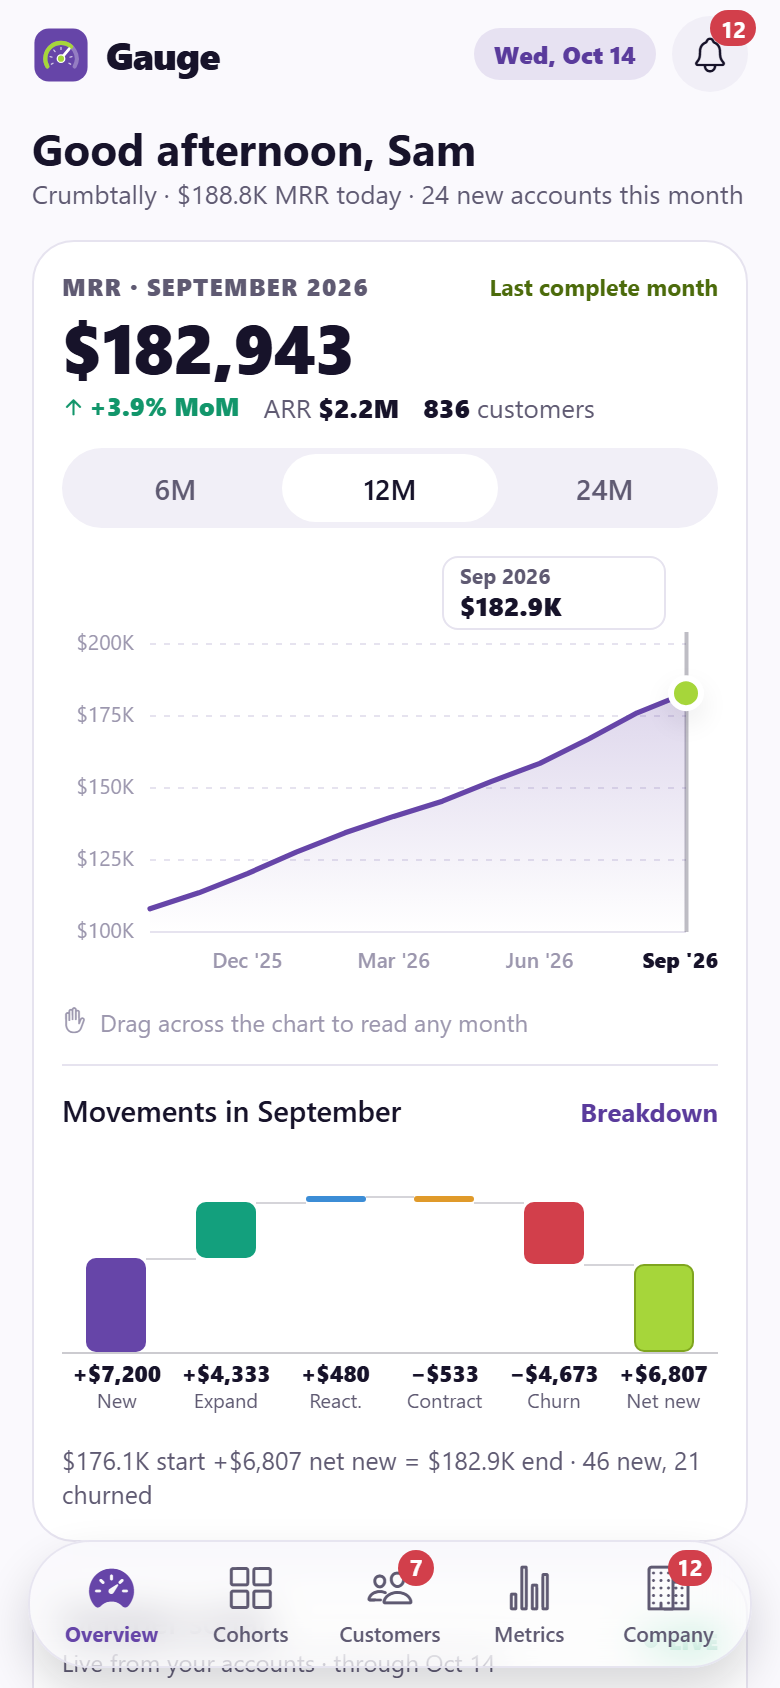
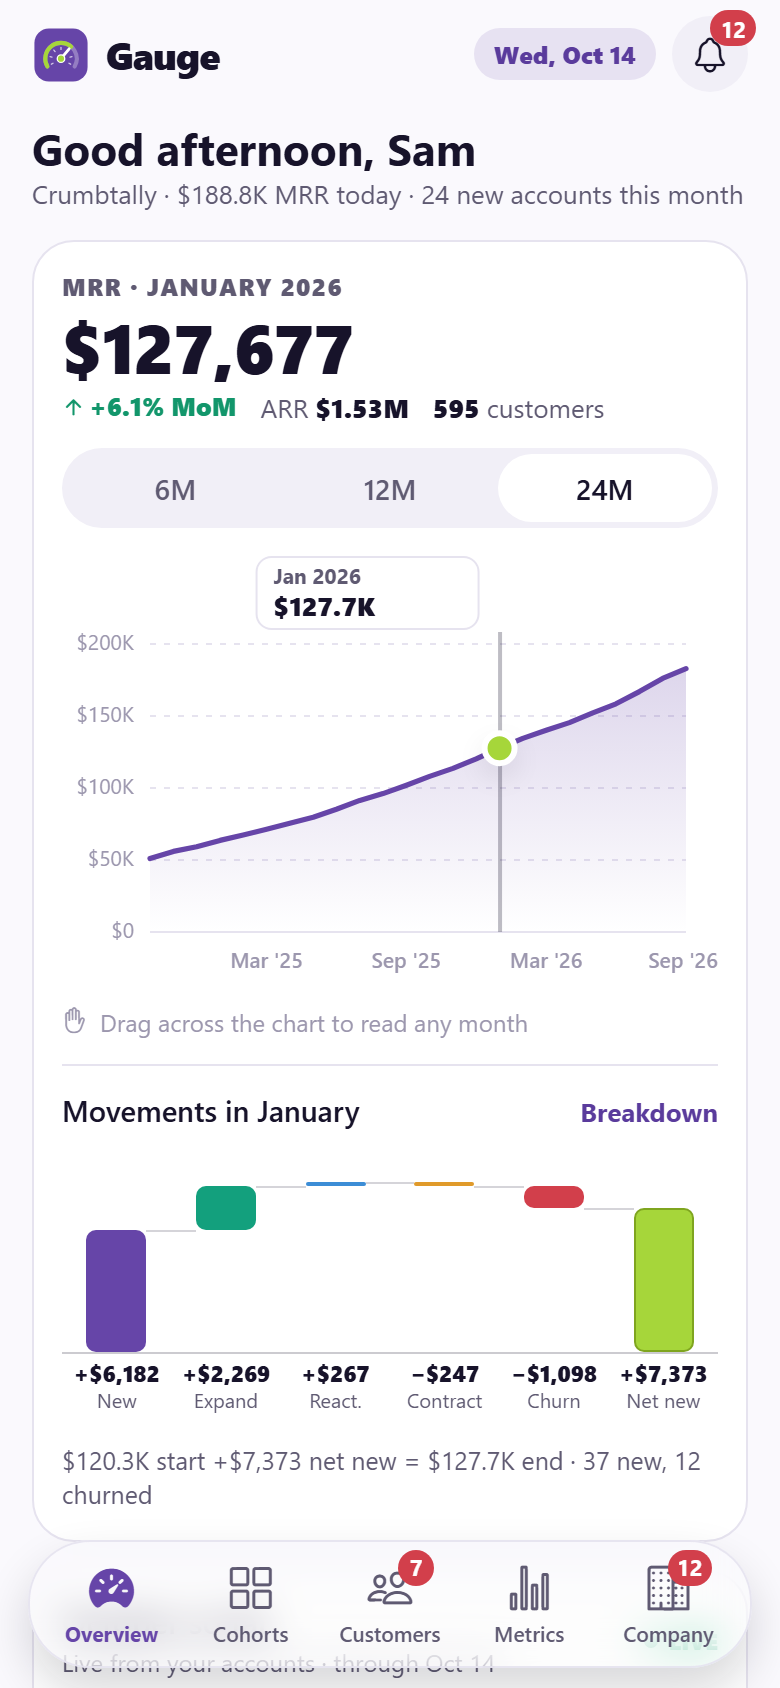
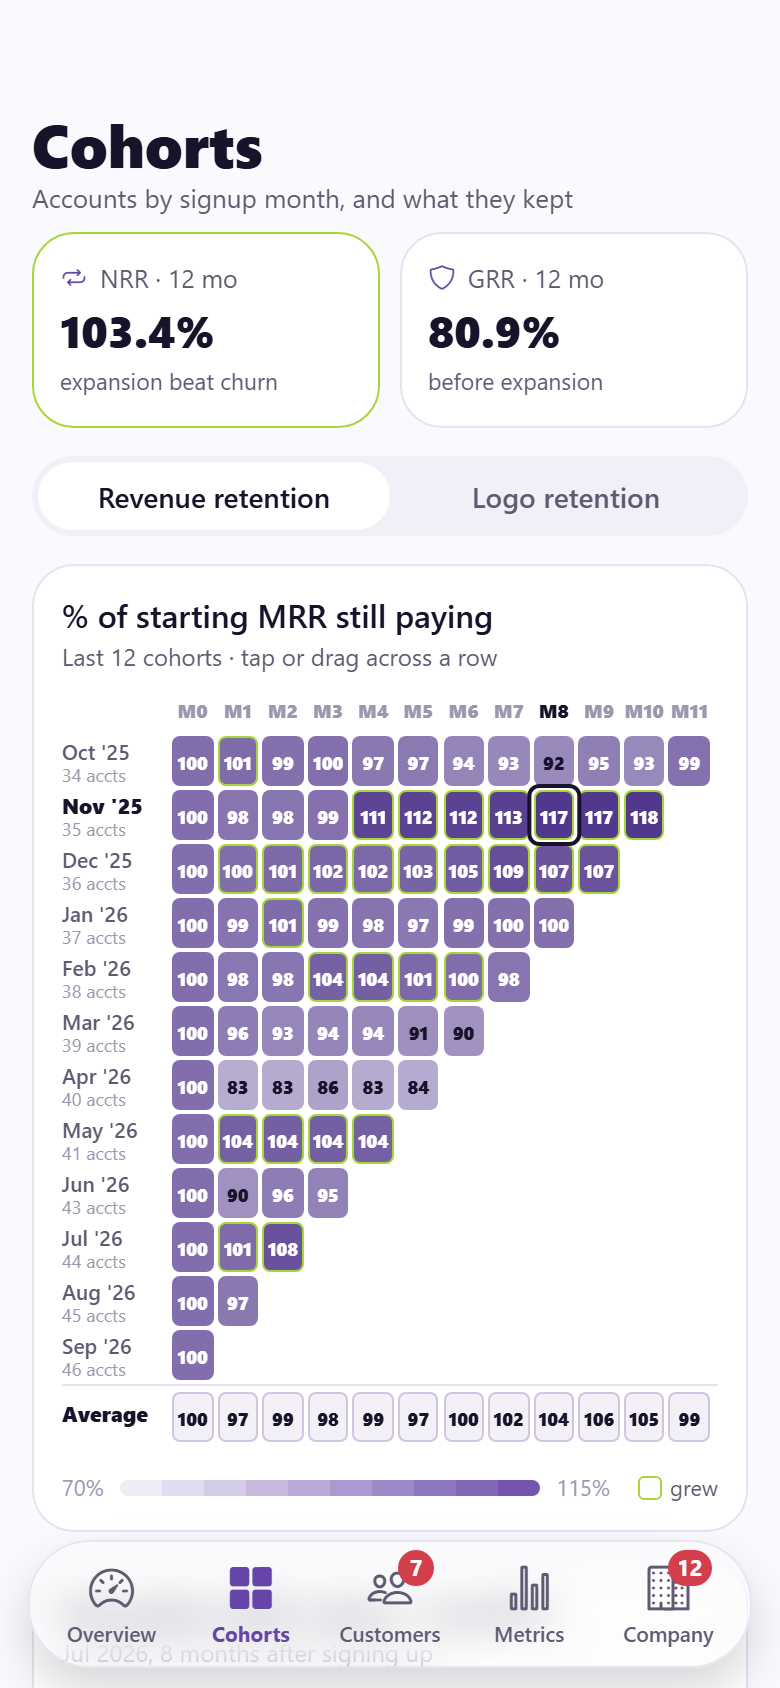
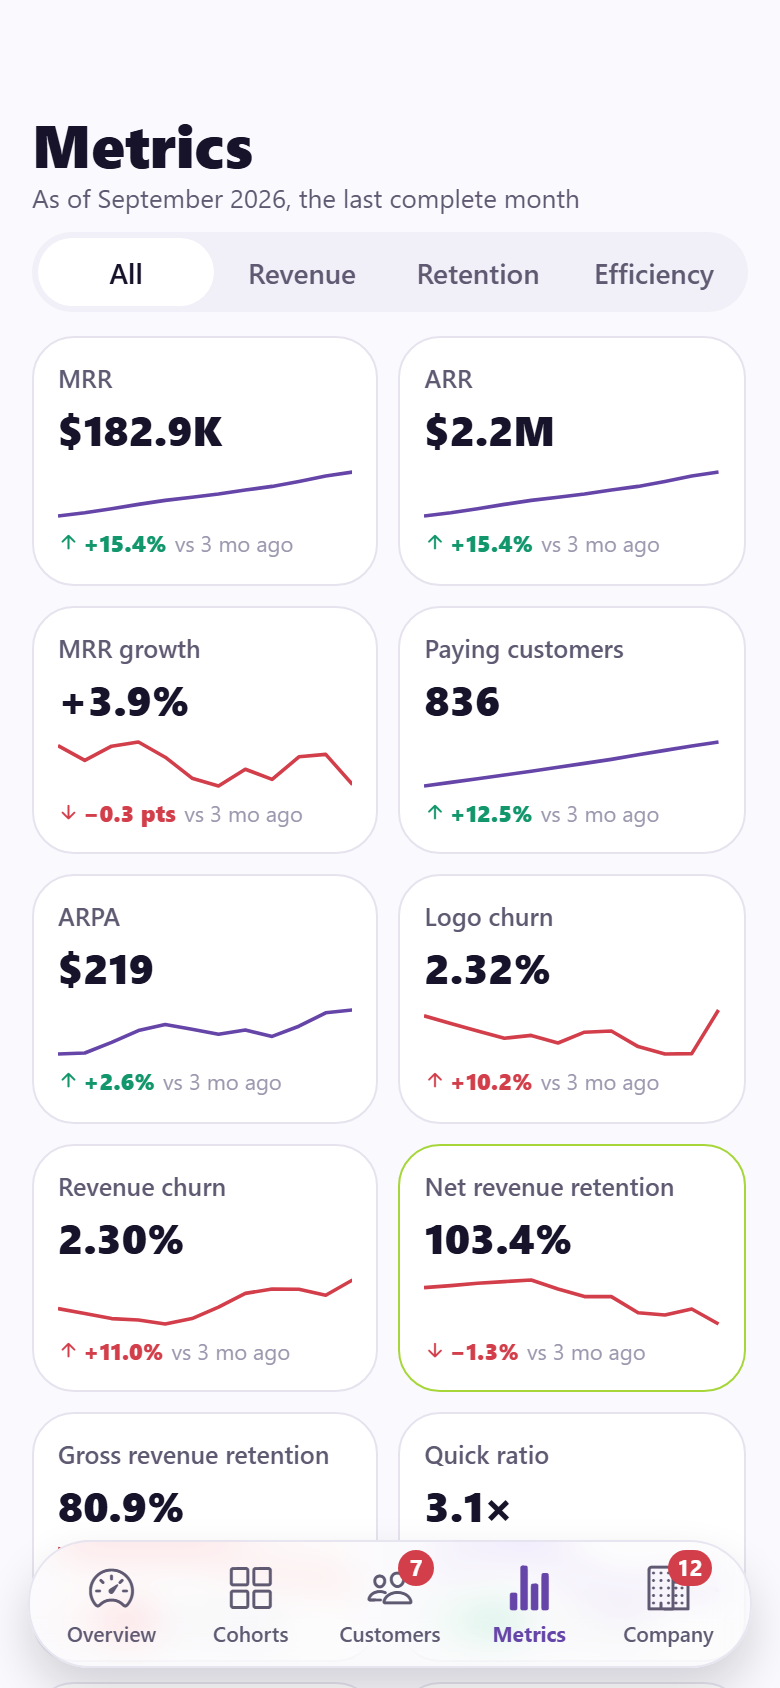
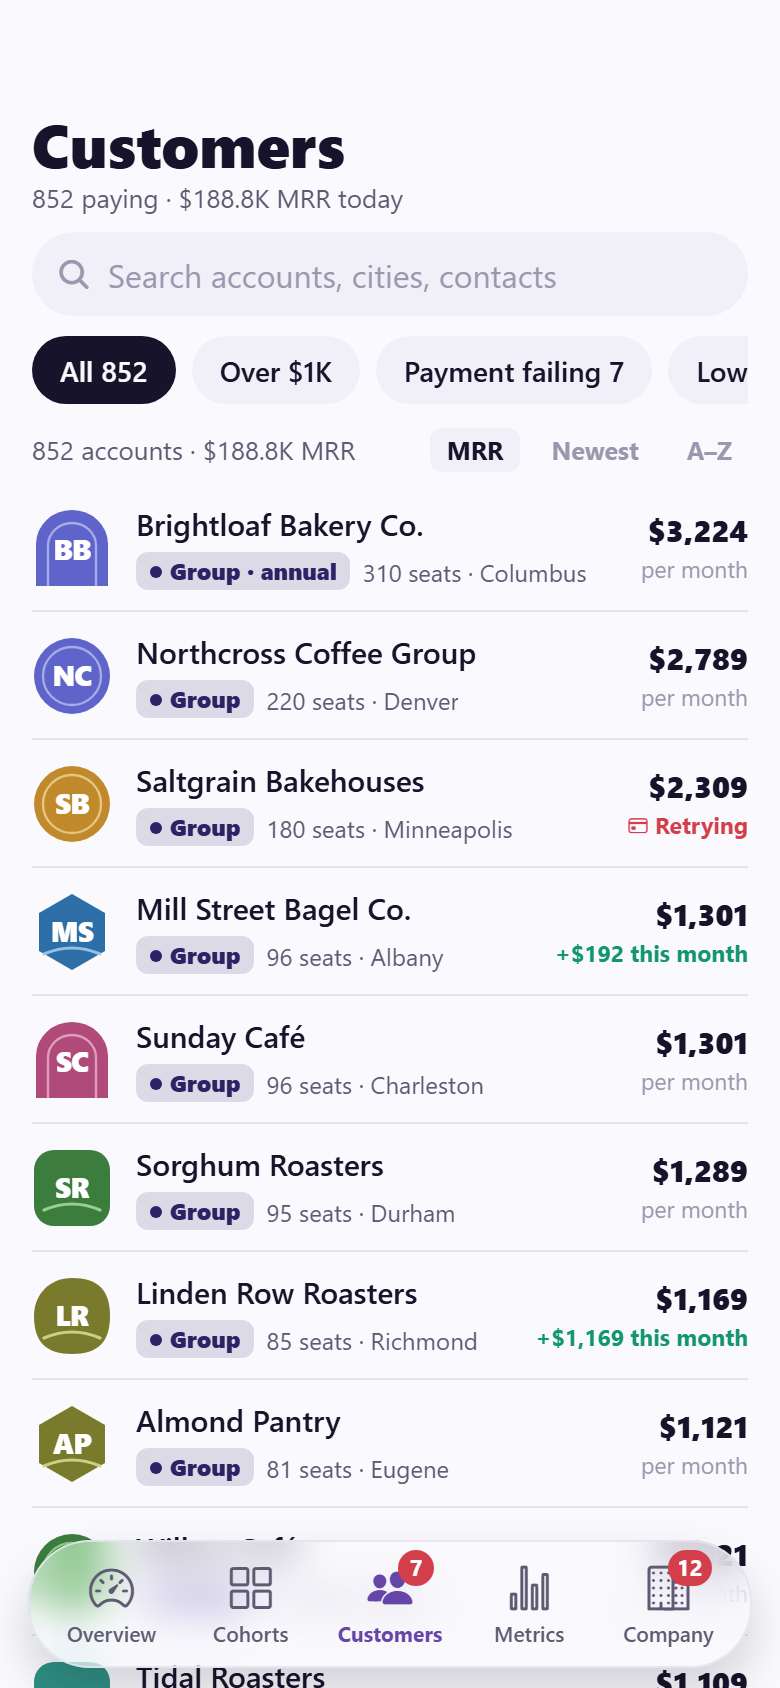
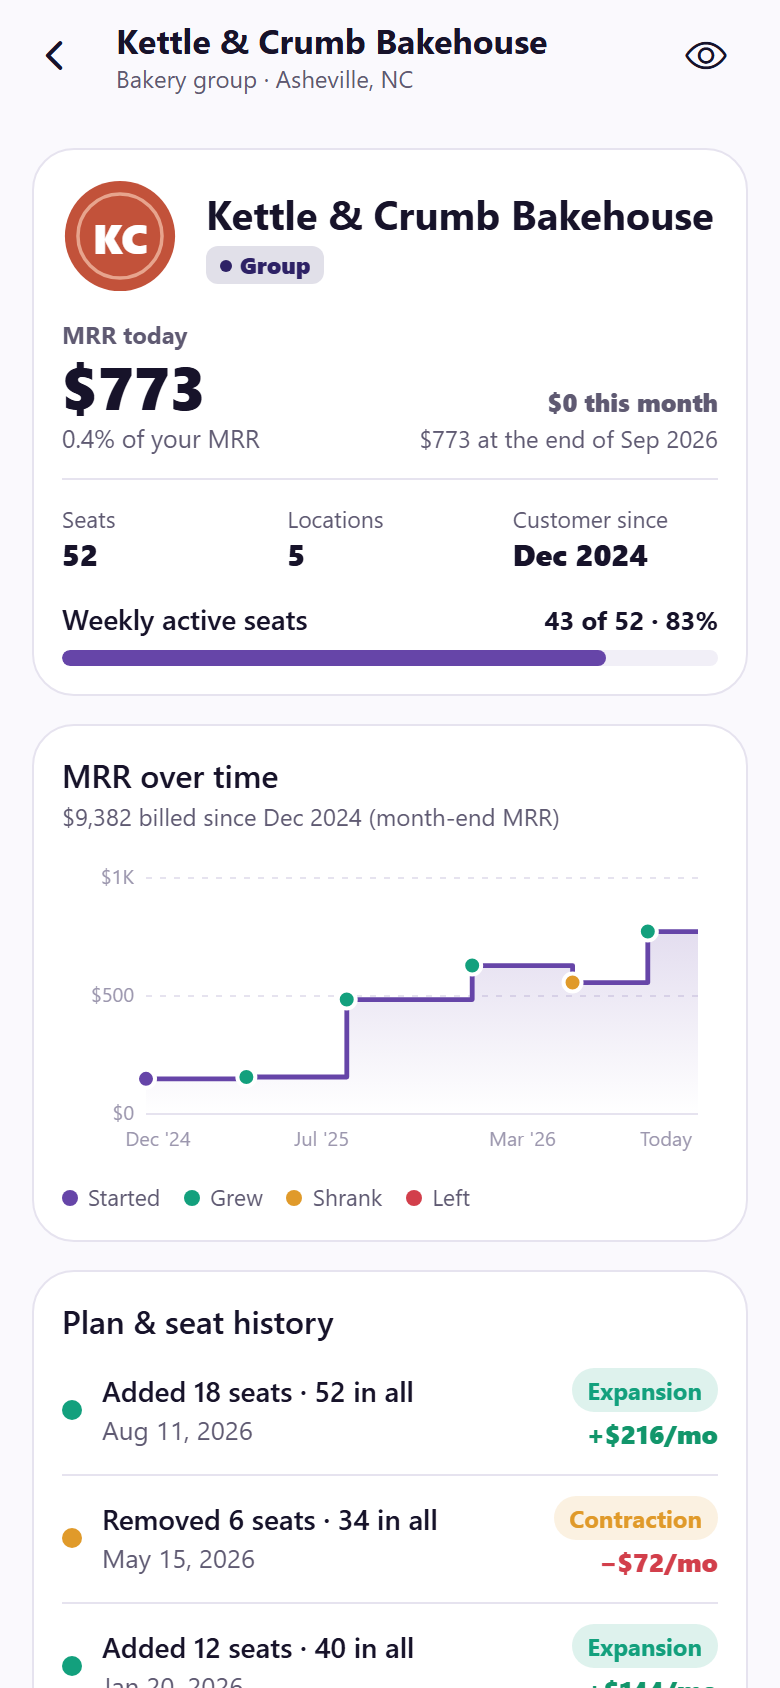
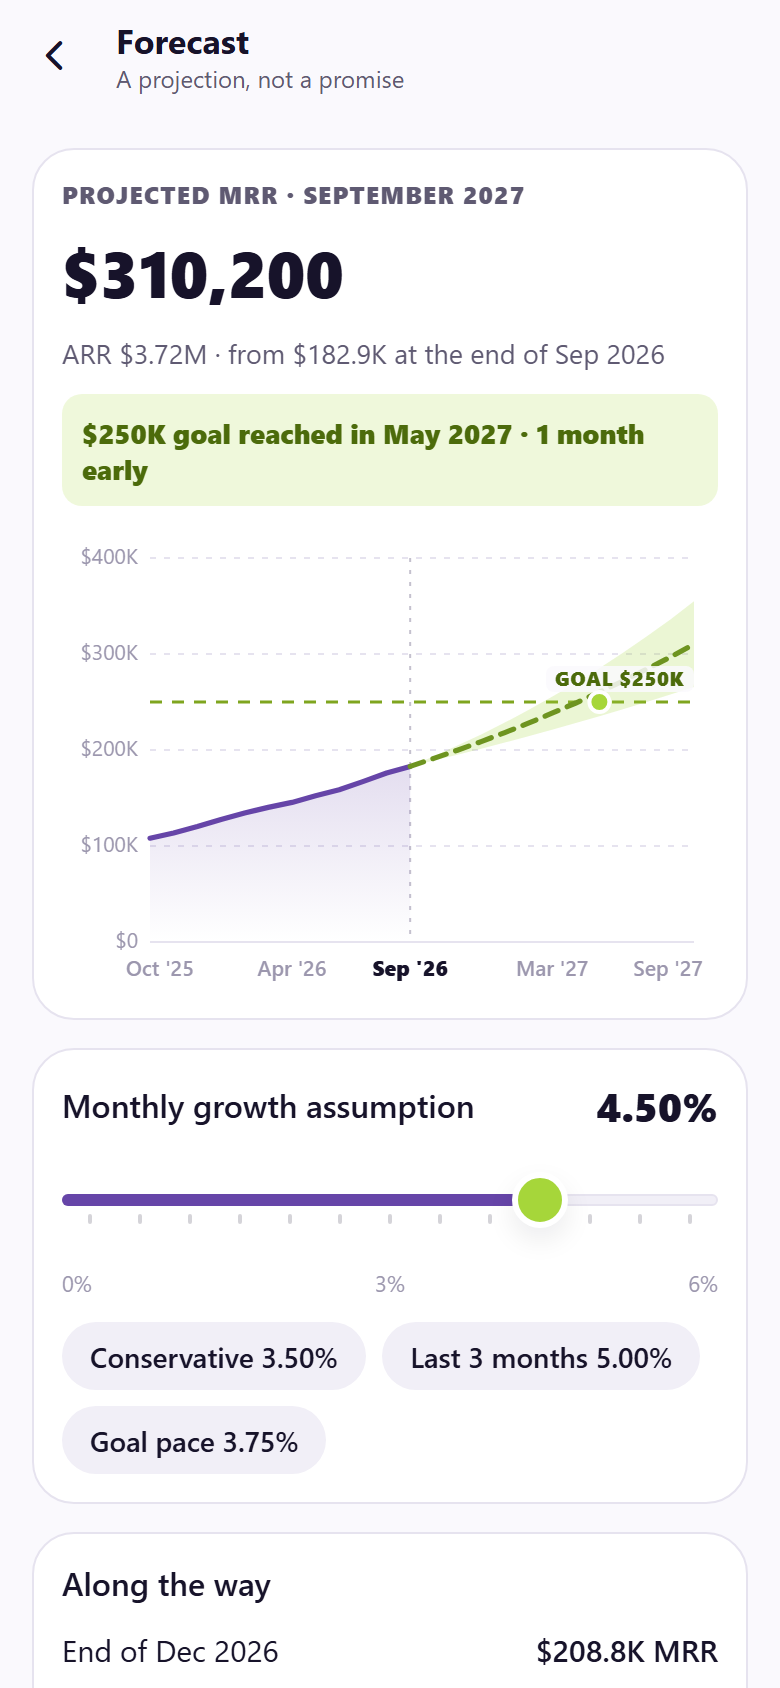
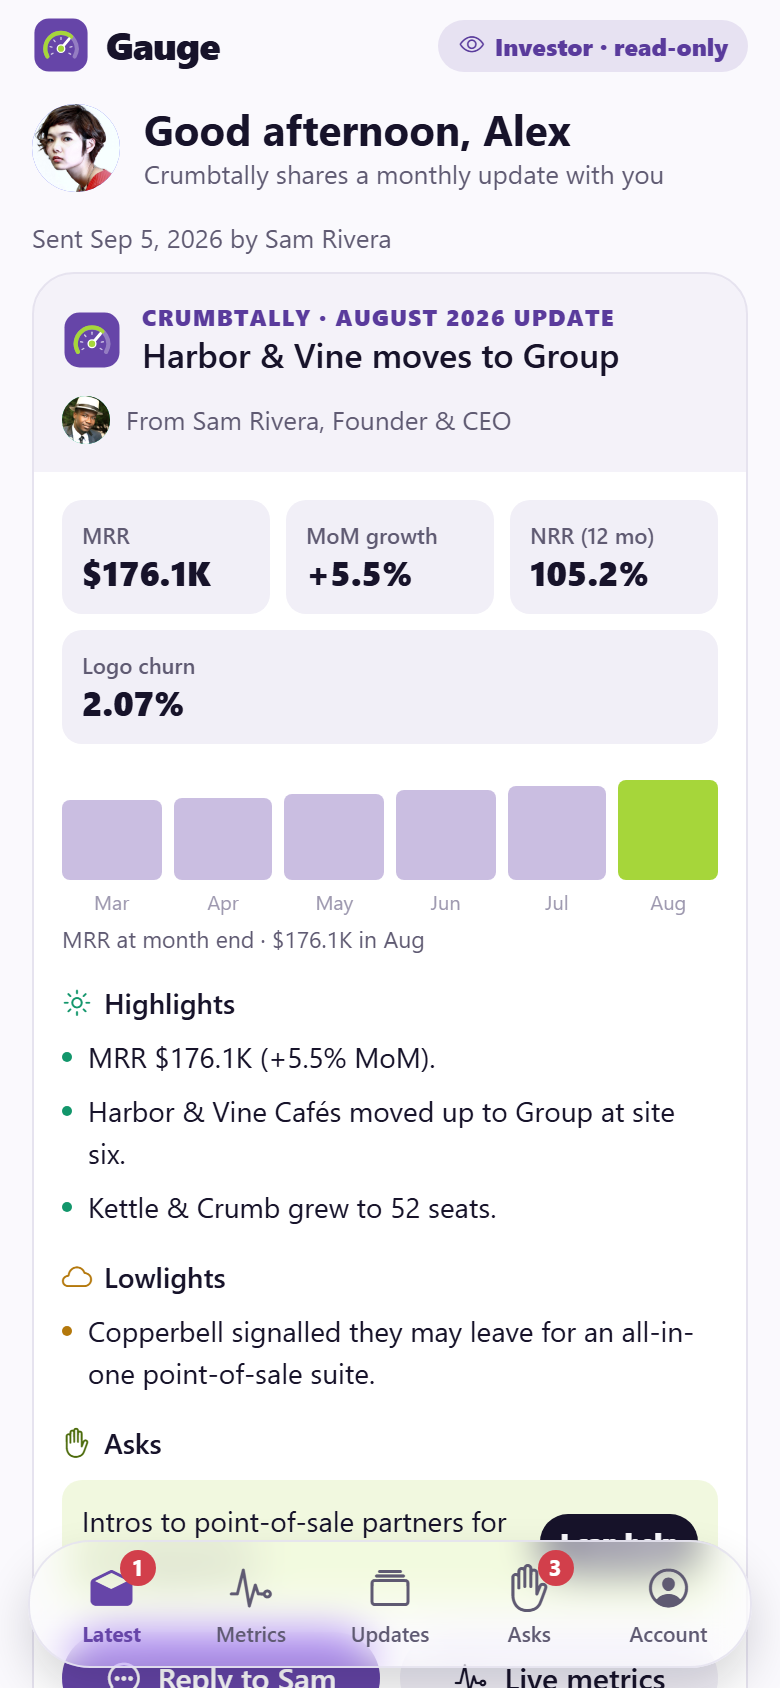
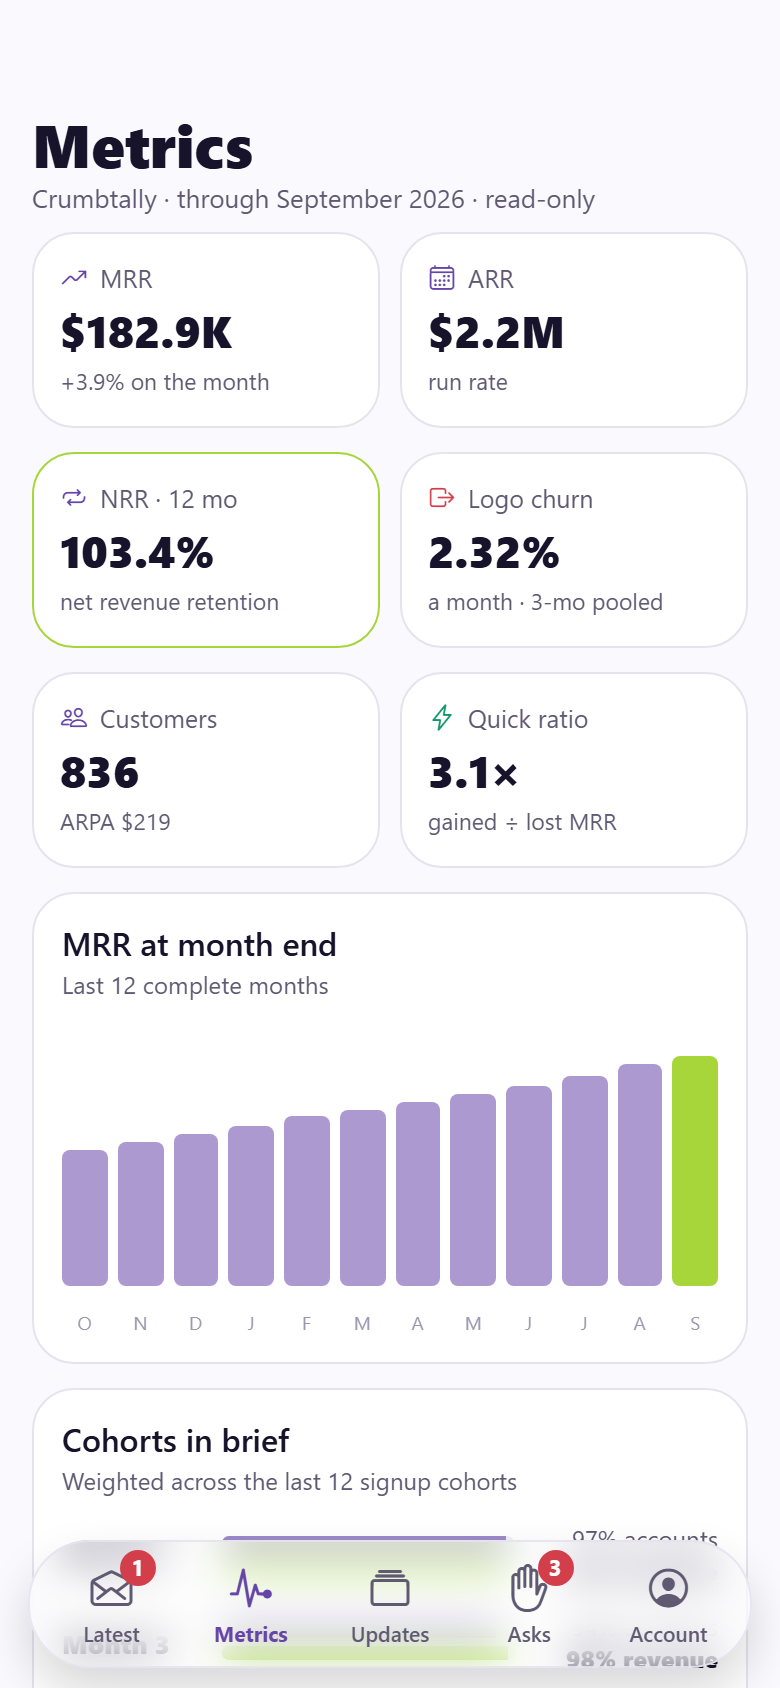
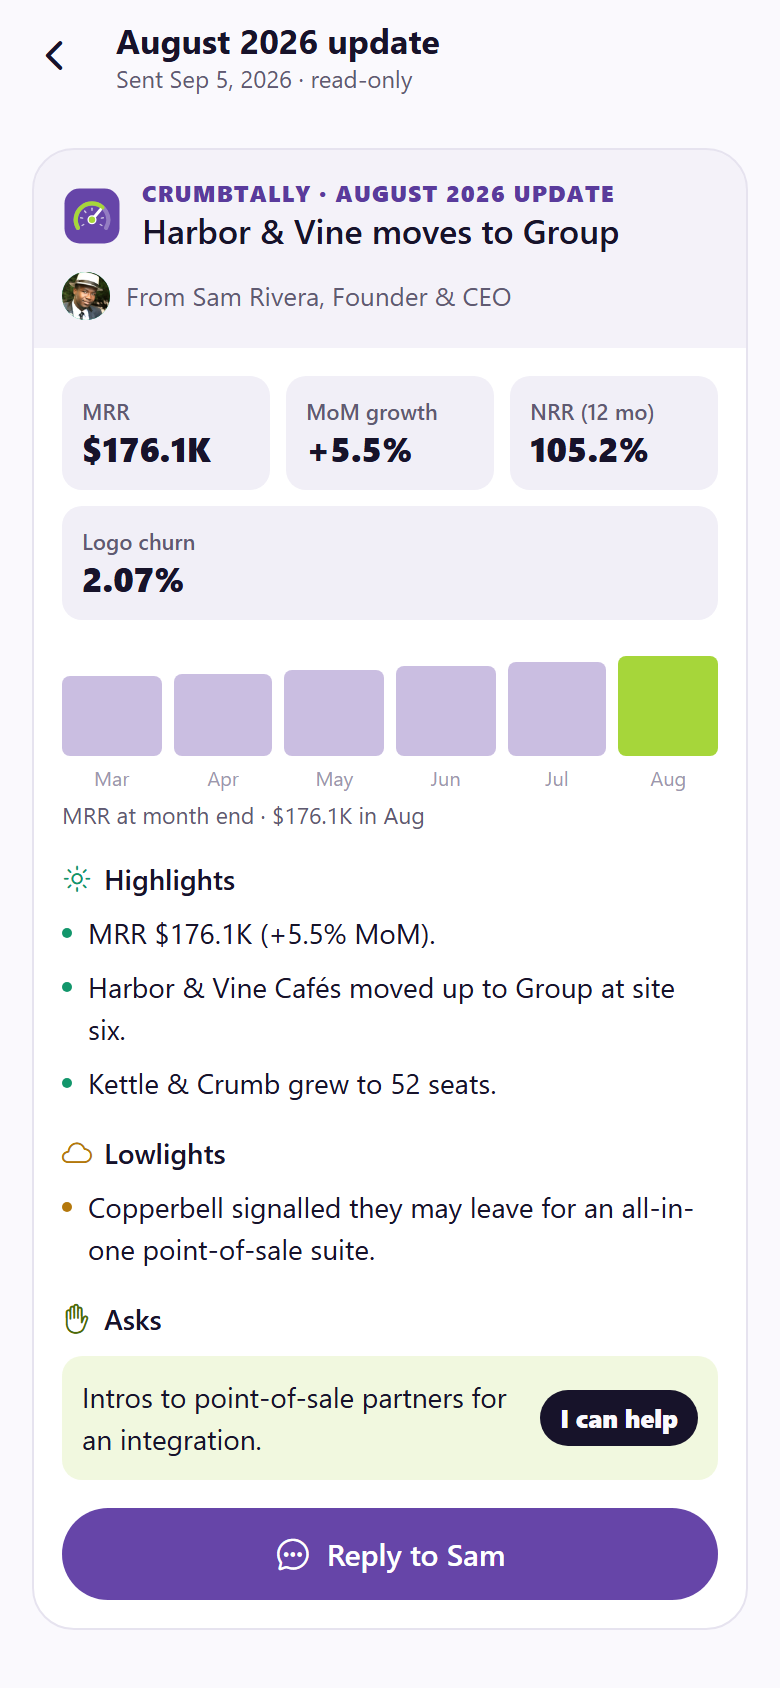
A startup founder's SaaS metrics dashboard, with the read-only investor view the founder shares, both in one app. The sample company is an invented B2B SaaS selling stock counts and supplier ordering to independent cafés on three seat-based plans plus annual, around $185K MRR and 860 paying accounts over two years of history. The Overview is an MRR line you scrub: drag across the chart and a lime knob rides the line one-to-one while the header rolls to that month's MRR, ARR, month-on-month growth and customer count, and a waterfall redraws the month's movements (new, expansion, reactivation, contraction, churn and net new), with the start-to-end reconciliation printed beneath; switch 6, 12 or 24 months. Then this month so far, live from the accounts; NRR, logo churn, quick ratio and CAC payback tiles; the MRR goal's progress and pace; payments retrying and the investor update waiting to go; and the month's biggest movers. Cohorts is a retention heatmap of the last twelve signup cohorts by months since signup, revenue or logo retention, with NRR highlighted and every cell that kept more revenue than it started with ringed in lime; tap or drag across it and a ring springs to the cell while a card reads that cohort's own accounts and MRR retained. Around them: every SaaS metric a board asks for as tiles with sparklines (MRR, ARR, growth, customers, ARPA, logo and revenue churn, NRR, GRR, quick ratio, LTV, CAC and CAC payback with the demo inputs labelled, trial to paid) each with its own page of definition, formula, inputs and twelve-month trend; customers with drawn monogram logos, search, filters and sorting; a customer record with its own MRR step chart, plan and seat history, usage and a failing payment to retry; a month's movement breakdown with the accounts behind each line; plans & pricing with the plan mix; failed payments and dunning recovery on a retry schedule (demo); a forecast whose projected line redraws as you drag the growth assumption, marked where it crosses the goal and labelled a projection; goals; alerts with rules and thresholds; data sources connected as staged demos with no real logos; search, onboarding with a demo billing import, profile, edit profile and settings. The investor update composer pulls the month's metrics into tiles, takes highlights, lowlights and asks, previews exactly what investors will see and shares it to the Investor side: the latest update read-only with "I can help" on each ask and a reply to the founder (both land in the founder's alerts), live read-only metrics with cohorts in brief, the archive, the asks, and an account page. Twenty-six screens on seeded customers (each with a compact history of plan and seat changes), monthly MRR snapshots that reconcile every month, cohorts, plans, failed payments, goals, investor updates, investors, alert rules and data sources.
26 screens, real flows
Make it yours by describing it
Tell Co-Create what to change, in plain words or a voice note. It asks what it needs to know, then shows you designs before anything is built.
Nothing changes until you approve
Approve one piece or a whole section. Every build gets a preview, and you can roll back to any earlier point.
Your app, your code
Go live on a clean address or your own domain, and download the full source whenever you like.
Your idea could be an app by Friday.
Start free. Talk it through, answer a few questions, pick a design and watch it build.
7 days freeCancel anytime